11.3 Exporting Graphics
RStudio makes it easy to export graphics: simply click on the “Export” icon in the “Plots” panel.
However, you can get much finer control over graphics export. When R produces graphical output, this output does not go to the console. Instead, it goes to what is known as a graphical device. That device might be the default R device shown in the “Plots” panel, but also a device that produces a graphics file such as a pdf, a svg, a png or a jpeg.
To choose one of these graphics devices, you need to first open it, then produce your plot, and then close it. To open one of the above listed graphics devices, you can use pdf(), svg(), png() or jpeg(). To close it, use dev.off().
The above code will produce a pdf called “text.pdf” in your working directory. Note that to have an effect, any call to par() must run after the graphic device was opened.
All functions to write graphics files takes as their first argument the filename, which may also contain a path, of course. Important additional arguments are width and height that specify the dimensions of the resulting plot. For vector graphics (e.g. pdf and svg), width and height indicate the size of the plot in inches. For raster graphics (e.g. png and jpeg), they specify the dimension in pixels.
Changing the dimension of a plot also affects the size of plotted elements relative to the plot. The best way to understand what is happening is to think of the plot dimensions as the size of the paper used for plotting, but to not affect the size of the font, for instance. Here is an illustration of what is happening to text when the paper size is increased: it will remain at the same size, and hence be smaller relative to the size of the plot.
> plot(0, type='n', xlim=c(0,1), ylim=c(0,1), xaxt='n', yaxt='n', xlab="", ylab="", bty='n')
> rect(0, 0, 0.5, 0.5)
> text(0.25, 0.25, "Text")
> rect(0, 0, 1, 1, lty=2)
> arrows(0.5, 0.5, 0.8, 0.8)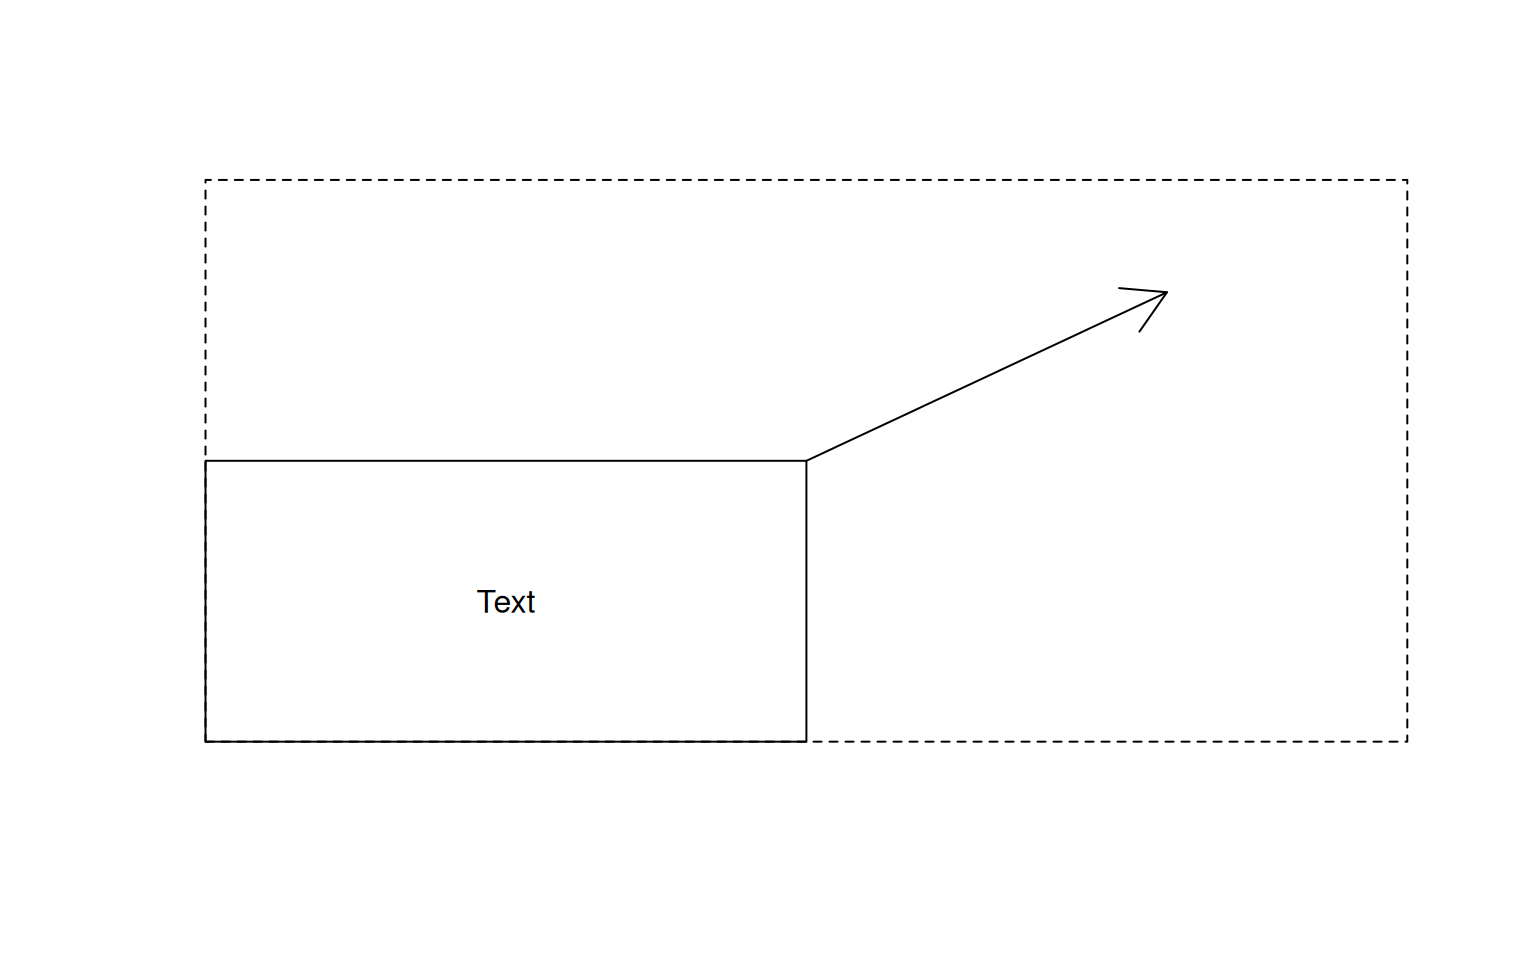 To increase the quality of a jpeg or png plot, you can therefore not simply increase the number of pixels with
 width and height: you will need also fiddle with pointsize and scale it accordingly.
> png("low_resolution.png", width=200, height=200, pointsize=12)
> plot(1:10)
> dev.off()
png
  2
> png("high_resolution.png", width=2000, height=2000, pointsize=120)
> plot(1:10)
> dev.off()
png
  2
Things are a bit easier with vectorized graphics that do not have a resolution. Hence, you can use width and height to adjust the relative size of the plot without worrying about pointsize.
Note that we generally recommend vector graphics for quality.
11.3.1 Exercises: Exporting graphics
See Section 18.0.32 for solutions.
Sample a vector \(\boldsymbol{x}\) of length 100 from a standard normal distribution \(x_i\sim \mathcal{N}(0,1)\). Generate a corresponding vector \(\boldsymbol{y}\) under the linear model \(y_i=4 + 1.5 x_i + \epsilon_i\) where the error rates \(\epsilon_i \sim \mathcal{N}(0, 0.2)\) are drawn randomly from a normal distribution with variance 0.2. Plot \(\boldsymbol{y}\) against \(\boldsymbol{x}\) in a pdf. Use
par()to adjust the margins to have minimal white space.Plot the same data again to another pdf, but change the dimensions to 2x2 inches. Appreciate how this makes everything much larger relative to the plot.
Plot the same data to two jpeg images with resolutions 480x480 and 1280x1280, but identical apart from the resolution.