9.2 Multiple panels
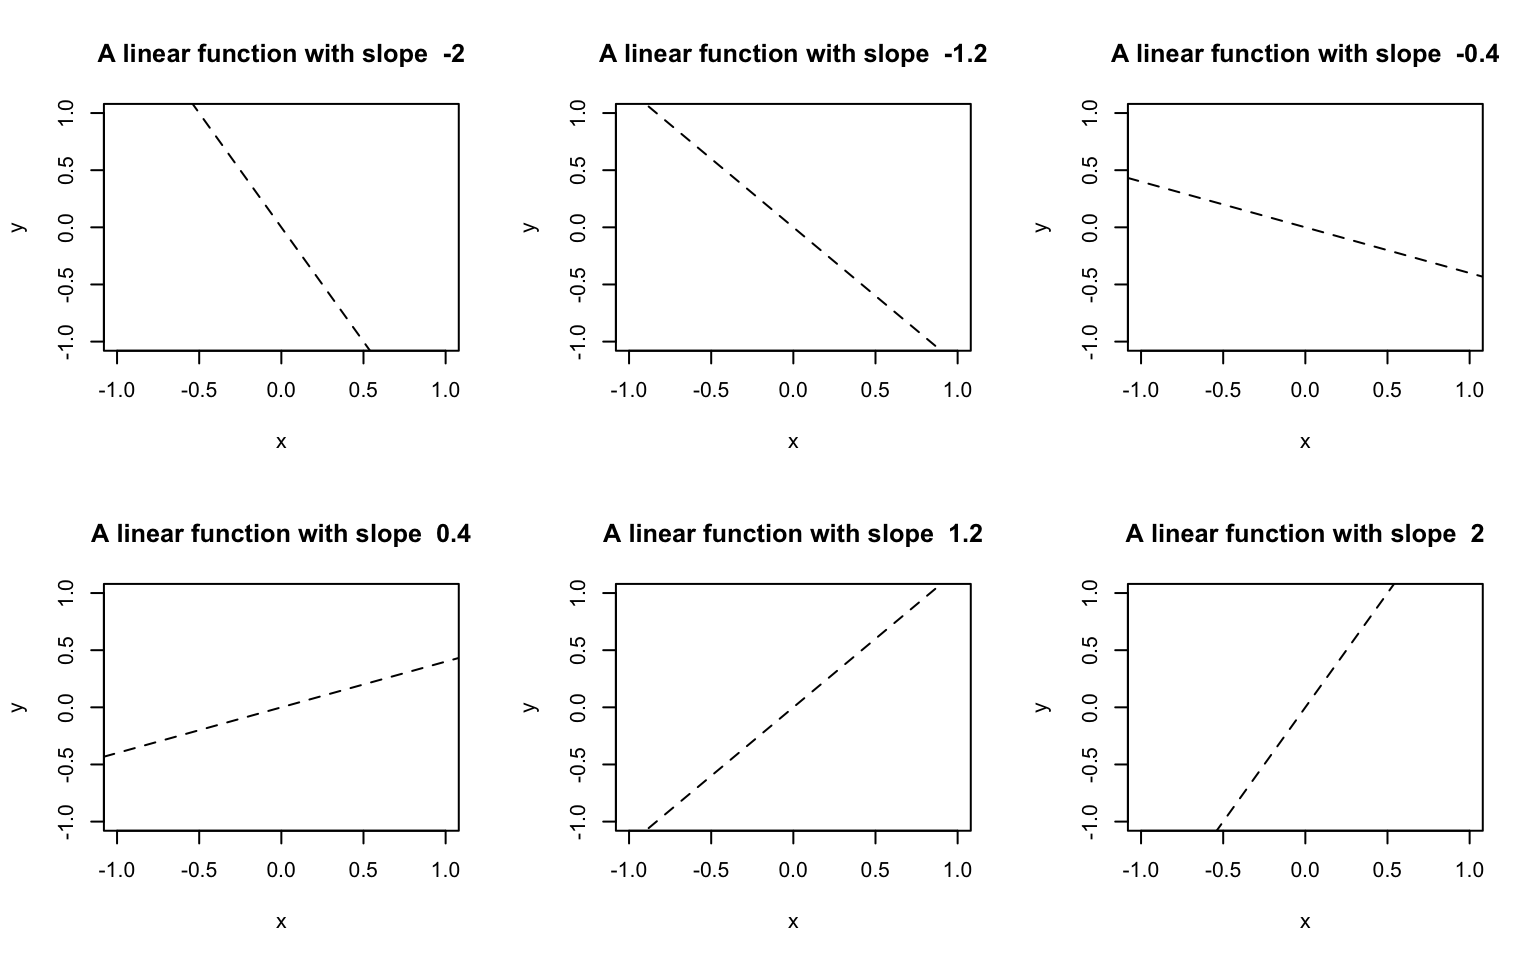
Often it may be desirable to create figures with multiple panels. That is rather straight forward with the par() option mfrow that specifies a grid of panels to be used via a vector with the desired number of rows and columns.
> x <- seq(-10, 10, length.out=31)
> par(mfrow=c(2,3), pch=16, lty=2)
> for(slope in seq(-2, 2, length.out=6)){
+    plot(0, type='n', main=paste("A linear function with slope ", slope), xlab="x", ylab="y", xlim=c(-1,1), ylim=c(-1, 1))
+   abline(a=0, b=slope)
+ }
If you want to plot multiple figures in a more unique composition, the layout() function is very helpful. Just as the mfrow option to par(), layout() divides the plotting area up into as many rows and columns as desired. However, you can further specify the relative heights and widths of each column and have some plots using multiple cells of your grid. The first argument of layout() is a matrix with the grid and the panel indexes, best explained with an example:
> layout(matrix(c(1, 1, 1, 2, 3, 4), nrow=2, byrow=TRUE), width=c(2, 1, 1), heights=c(3,2))
> for(i in 1:4){
+    plot(i, i, pch=as.character(i), cex=2)
+ }
Once you set some options with
 par() or layout(), you may wonder how to unset them. There are two possibilities: you overwrite them with another call to either par() or layout(), or you close the graphics device altogether and start anew. To close a graphics device, use dev.off(). You will learn about graphics devices in the next section.
9.2.1 Exercises: Plotting Multiple Pannels
See Section 18.0.23 for solutions.
Create a data frame with three columns x, y, and z as follows: x contains a vector with 1.0, 1.5, 2.0, 2.5, … 100, each element of y is \(y_i=\sqrt(x_i)\), and each element of z is \(z_i=log(x_i)\). Plot y and z against x in two panels next to each other and use titles to identify the transformations.
Use a
forloop andpar()to create a plot with 12 panels arranges in a 3x4 layout. Each panel should plot the log of the valuesx <- 1:100for different bases ofbases <- 2:13. Each plot should use a different color and a different plotting symbol. Write the base used to the lower-right corner.Use the layout function to plot four figures of a against x, one in the top row, two in the middle row and again one in the bottom row. Use any colors and symbols that you like.